7. Statistics and Reports
7.1. File format
By default, Tsung use its own format (see FAQ What is the format of the stats file tsung.log?).
Since version 1.4.2, you can configure Tsung to use a JSON format; however in this case, the tools tsung_stats.pl and tsung_plotter will not work with the JSON files.
To enable JSON output, use:
<tsung backend="json" ...>
Example output file with JSON:
{
 "stats": [
 {"timestamp": 1317413841,  "samples": []},
 {"timestamp": 1317413851,  "samples": [
   {"name": "users", "value": 0, "max": 0},
   {"name": "users_count", "value": 0, "total": 0},
   {"name": "finish_users_count", "value": 0, "total": 0}]},
 {"timestamp": 1317413861,  "samples": [
   {"name": "users", "value": 0, "max": 1},
   {"name": "load", "hostname": "requiem", "value": 1, "mean":
     0.0,"stddev": 0,"max": 0.0,"min": 0.0 ,"global_mean": 0
     ,"global_count": 0},
   {"name": "freemem", "hostname": "requiem", "value": 1, "mean":
     2249.32421875,"stddev": 0,"max": 2249.32421875,"min":
     2249.32421875 ,"global_mean": 0 ,"global_count": 0},
   {"name": "cpu", "hostname": "requiem", "value": 1, "mean":
     4.790419161676647,"stddev": 0,"max": 4.790419161676647,"min":
     4.790419161676647 ,"global_mean": 0 ,"global_count": 0},
   {"name": "session", "value": 1, "mean": 387.864990234375,"stddev":
    0,"max":  387.864990234375,"min": 387.864990234375
    ,"global_mean": 0 ,"global_count": 0},
  {"name": "users_count", "value": 1, "total": 1},
  {"name": "finish_users_count", "value": 1, "total": 1},
  {"name": "request", "value": 5, "mean": 75.331787109375,"stddev":
    46.689242405019954,"max":  168.708984375,"min": 51.744873046875
    ,"global_mean": 0 ,"global_count": 0},
  {"name": "page", "value": 1, "mean": 380.7548828125,"stddev":
    0.0,"max":  380.7548828125,"min": 380.7548828125 ,"global_mean":
    0 ,"global_count": 0},
  {"name": "connect", "value": 1, "mean": 116.70703125,"stddev":
    0.0,"max":  116.70703125,"min": 116.70703125 ,"global_mean": 0
    ,"global_count": 0},
  {"name": "size_rcv", "value": 703, "total": 703},
  {"name": "size_sent", "value": 1083, "total": 1083},
  {"name": "connected", "value": 0, "max": 0}, {"name": "http_304", "value": 5, "total": 5}]}]}
7.2. Available stats
requestResponse time for each request.pageResponse time for each set of requests (a page is a group of request not separated by a thinktime).connectDuration of the connection establishment.reconnectNumber of reconnection.size_rcvSize of responses in bytes.size_sentSize of requests in bytes.sessionDuration of a user’s session.usersNumber of simultaneous users (it’s session has started, but not yet finished).connectednumber of users with an opened TCP/UDP connection (example: for HTTP, during a think time, the TCP connection can be closed by the server, and it won’t be reopened until the thinktime has expired). new in 1.2.2.- custom transactions
The mean response time (for requests, page, etc.) is computed every 10 sec (and reset). That’s why you have the highest mean and lowest mean values in the Stats report. Since version 1.3.0, the mean for the whole test is also computed.
7.2.1. HTTP specific stats:
- counter for each response status (200, 404, etc.)
7.2.2. Jabber specific stats:
request_noackCounter ofno_ackrequests. Since response time is meaningless withno_ackrequests, we keep a separate stats for this. new in 1.2.2.async_unknown_data_rcvOnly if bidi is true for a session. Count the number of messages received from the server without doing anything. new in 1.2.2.async_data_sentOnly if bidi is true for a session. Count the number of messages sent to the server in response of a message received from the server. new in 1.2.2.
7.2.3. OS monitoring stats:
{load,<host>}System load average during the last minute{cpu,<host}CPU percentage (Maximum is 100%, ex: on dual core system, 100% means: both cores are 100% used){freemem,<host>}Free Memory
7.3. Design
A bit of explanation on the design and internals of the statistics engine:
Tsung was designed to handle thousands of requests/sec, for very long period of times (several hours) so it do not write all data to the disk (for performance reasons). Instead it computes on the fly an estimation of the mean and standard variation for each type of data, and writes these estimations every 10 seconds to the disk (and then starts a new estimation for the next 10 sec). These computations are done for two kinds of data:
sample, for things like response timesample_counterwhen the input is a cumulative one (number of packet sent for ex.).
There are also two other types of useful data (no averaging is done for those):
counter: a simple counter, for HTTP status code for ex.sumfor ex. the cumulative HTTP response’s size (it gives an estimated bandwidth usage).
7.4. Generating the report
Since version 1.6.0, you can use the embedded web server started
by the controller on port 8091. So for example if your controller is
running on node0, use the URL http://node0:8091/ in your
browser. It will display the current status of Tsung (see
Dashboard ) and generate on the fly the report and
graphs. There’s also an option when you start Tsung to keep the
controller alive, even when the test if finished, in order to use the
embedded web server (see -k option). By default the web server
will stop when the test is finished.
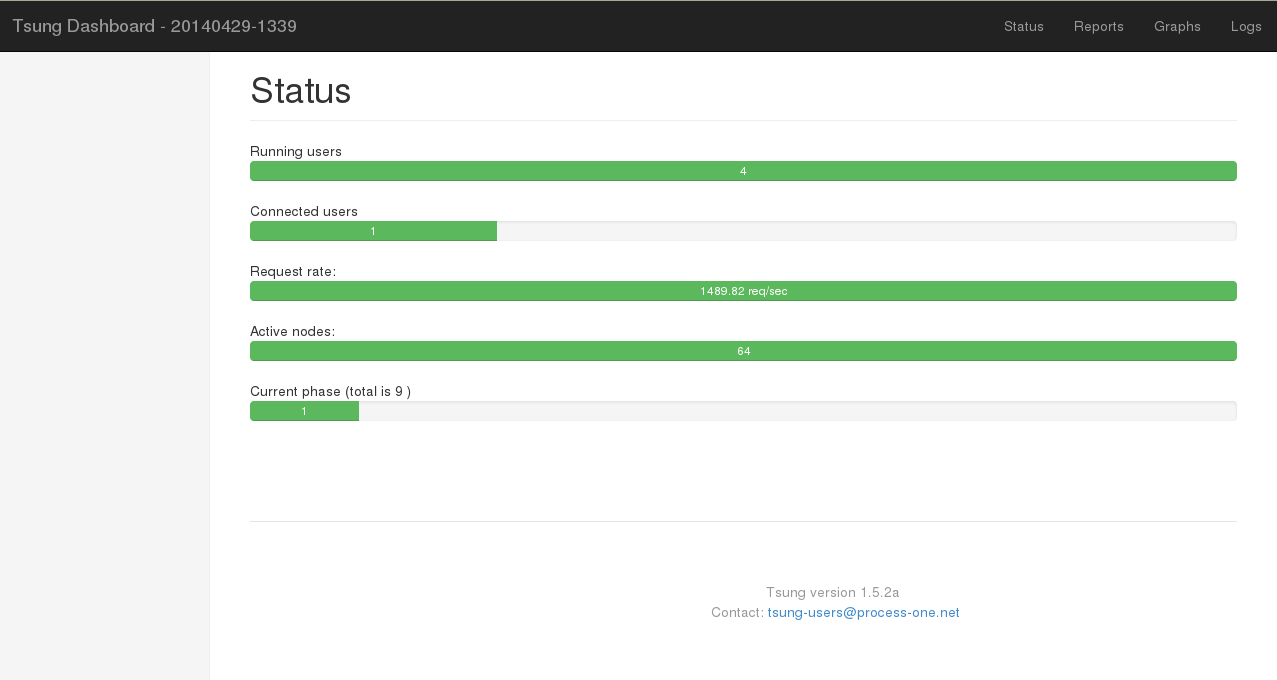
Dashboard
You can still generate the reports by manually during or after the tests:
cd to the log directory of your test (say
~/.tsung/log/20040325-16:33/) and use the script
tsung_stats.pl:
/usr/lib/tsung/bin/tsung_stats.pl
Note
You can generate the statistics even when the test is running!
use –help to view all available options:
Available options:
       [--help] (this help text)
       [--verbose] (print all messages)
       [--debug] (print receive without send messages)
       [--dygraph] use dygraphs (http://dygraphs.com) to render graphs
       [--noplot]  (don't make graphics)
       [--gnuplot <command>]  (path to the gnuplot binary)
       [--nohtml]  (don't create HTML reports)
       [--logy]  (logarithmic scale for Y axis)
       [--tdir <template_dir>] (Path to the HTML tsung templates)
       [--noextra  (don't generate graphics from extra data (os monitor, etc)
       [--rotate-xtics  (rotate legend of x axes)
       [--stats <file>] (stats file to analyse, default=tsung.log)
       [--img_format <format>] (output format for images, default=png
                                available format: ps, svg, png, pdf)
Version 1.4.0 adds a new graphical output based on http://dygraphs.com.
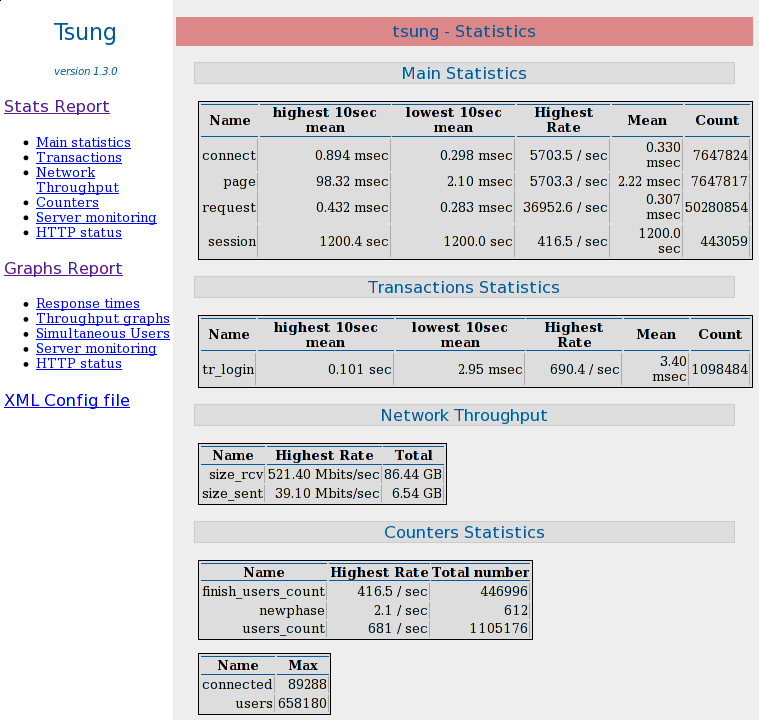
7.6. Graphical overview
Figure Graphical output shows an example of a graphical report.
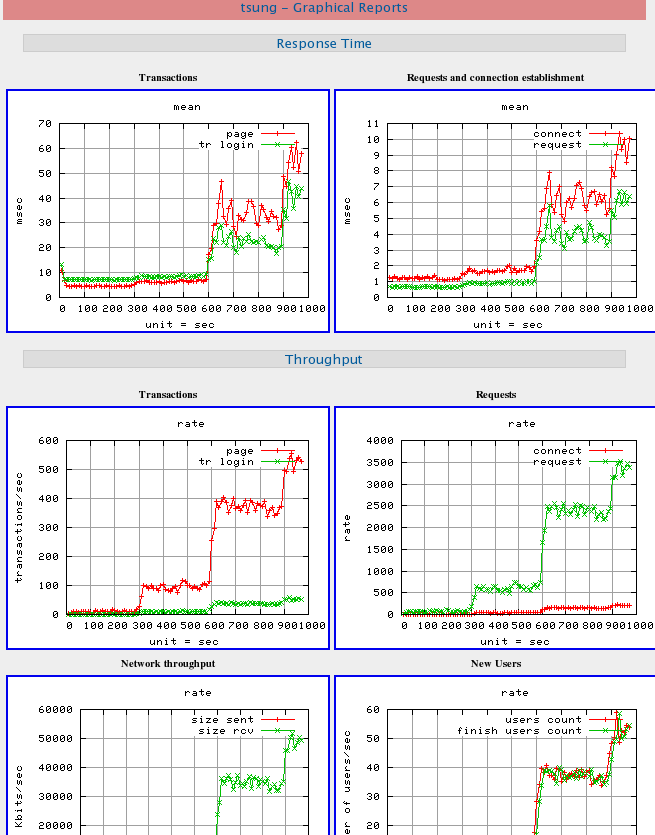
Graphical output
7.7. Tsung Plotter
Tsung-Plotter (tsplot} command) is an optional tool recently
added in the Tsung distribution (it is written in Python), useful to
compare different tests ran by Tsung. tsplot is able to
plot data from several tsung.log files onto the same charts,
for further comparisons and analyzes. You can easily customize the
plots you want to generate by editing simple configuration files. You
can get more information in the manual page of the tool (man
tsplot).
Example of use:
tsplot "First test" firsttest/tsung.log "Second test" secondtest/tsung.log -d outputdir
Here’s an example of the charts generated by tsplot (figure Graphical output of tsplot):
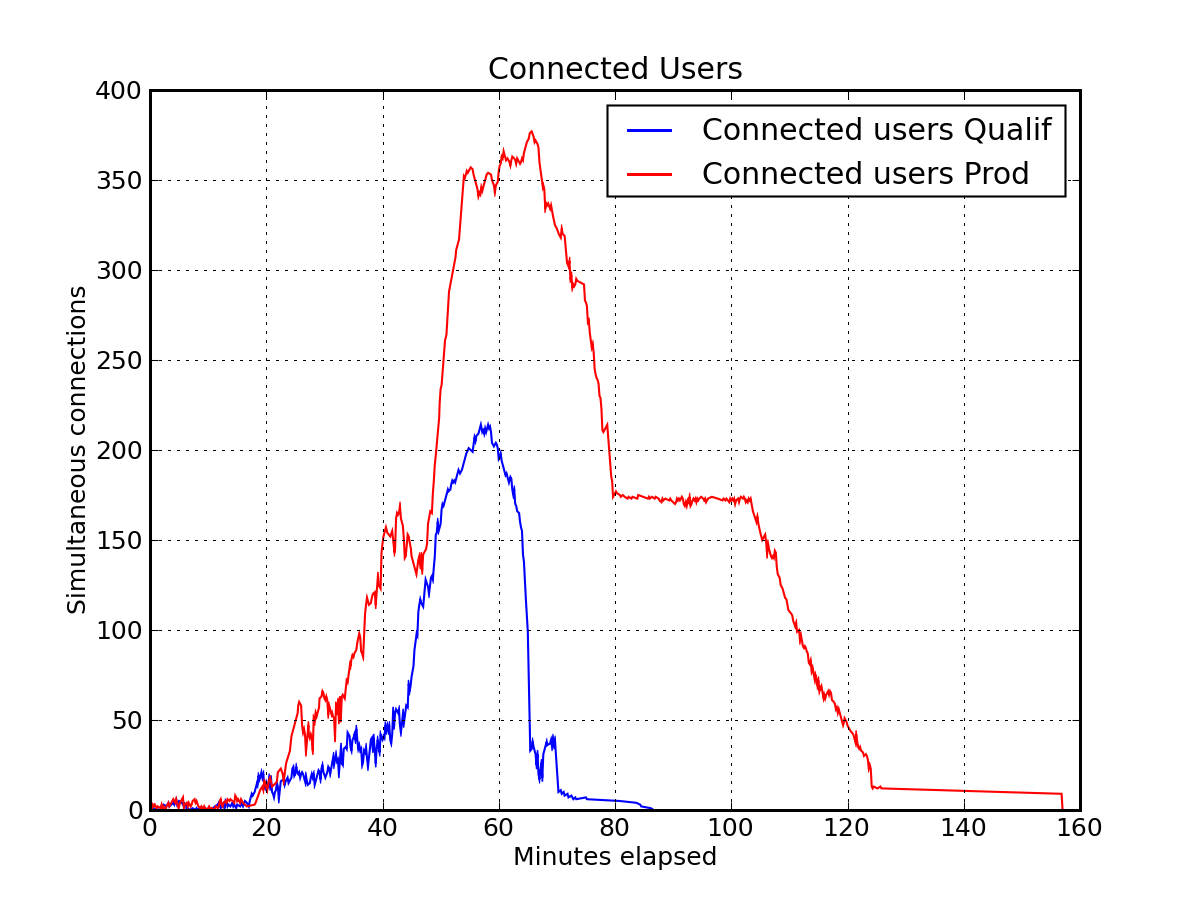
Graphical output of tsplot
7.8. RRD
A contributed perl script tsung-rrd.pl is able to create rrd
files from the Tsung log files. It’s available in /usr/lib/tsung/bin/tsung-rrd.pl.